Description of Model output
As a result of running the SLM model, 3 different types of files are generated, which the user can download in a packed output.zip file. The three different files are as follows based on their content:
- depout.dat: Deposition distributions in different regions of the lung for values of multiple_run option.
- geometry_**.dat: Lung geometry for the modeled lung generations. This file is generated separately for each value (_**) of parameter defined in multiple_run.
- output_**.dat: Average deposition fraction for all simulated lung generations. This file is also generated separately for each value (_**) defined in multiple_run.
Every generated resulting output file header contains the values of certain input parameters.
The following sections detail the contents of each file.
depout.dat
This file provides key insights into the distribution of inhaled particles across different lung regions.
Each row in the file corresponds to a different value of the parameter defined in the multiple_run and detailed in the corresponding input parameter box.
The columns represent the deposition ratios for the particles in various regions of the respiratory system:
- Column 1 (parameter selected from the multiple_run list): The values of the selected parameter, as specified in the input.
- Column 2 (avg_ET): The average deposition fraction of particles in the extrathoracic region of the lungs.
- Column 3 (avg_br): The average deposition fraction of particles in the bronchial region of the lungs.
- Column 4 (avg_ac): The average deposition fraction of particles in the acinar region of the lungs.
- Column 5 (avg_tot): The total average deposition fraction of particles across the entire lung.
Example of depout.dat file:
# Inhalation time : 2.5
# Breath hold time : 0
# Tidal volume : 750
        #particle_diameter    avg_ET        avg_br      avg_ac      avg_tot
        0.1                   0.04583       0.09053     0.26568     0.40203
        0.2                   0.03618       0.05879     0.20226     0.29722
        0.3                   0.03767       0.04611     0.18300     0.26678
        0.4                   0.04445       0.03970     0.16696     0.25111
        0.5                   0.05507       0.03678     0.16347     0.25531
In this run, we selected the particle_diameter parameter in the multiple_run and performed the run for 5 different particle sizes. Thus, in each row, the average deposition fraction values for the different particle sizes (0.1, 0.2, 0.3, 0.4 and 0.5 µm) are provided for the 3 different lung regions (Extrathoracic, bronchial and acinar region) as well as their total (total).
geometry_**.dat
This file provides key insights into the generated geometry of lung generations across different lung regions. Based on the built-in lung parameter distributions the model determines a new diameter, length, gravitational angle, and branching angle for each particle path. The average of these parameters are then determined by averaging each by the number of particle paths (thus, number of simulations). These average values are summarized in this file.
It is important to note that when calculating the average size of the bronchial airways, only the bronchial airways are considered, and for the acinar airways, only the acinar airways are taken into account. 12th to 21st generations are mixed, which means that depending on the specific particle path, both bronchial and acinar airways may be present.
Each row in the file corresponds to a different generation number.
The columns represent the following parameters of geometry:
- Column 1 (gen): The generation number of the lung.
- Column 2 (avg_len): The average length of lung generation.
- Column 3 (avg_diam): The average diameter of lung generation.
- Column 4 (avg_bran_ang): The average branching of lung generation.
- Column 5 (avg_grav_ang): The average gravitational of lung generation.
- Column 6 (avg_bron_len): The average length of lung generation in bronchial region of the lungs.
- Column 7 (avg_bron_diam): The average diameter of lung generation in bronchial region of the lungs.
- Column 8 (avg_bron_bran_ang): The average branching of lung generation in bronchial region of the lungs.
- Column 9 (avg_bron_grav_ang): The average gravitational of lung generation in bronchial region of the lungs.
- Column 10 (avg_acin_len): The average length of lung generation in acinar region of the lungs.
- Column 11 (avg_acin_diam): The average diameter of lung generation in acinar region of the lungs.
- Column 12 (avg_acin_bran_ang): The average branching of lung generation in acinar region of the lungs.
- Column 13 (avg_acin_grav_ang): The average gravitational of lung generation in acinar region of the lungs.
Example of geometry_**.dat file:
    #gen    avg_len     avg_diam    avg_bran_ang    avg_grav_ang    avg_bron_len    avg_bron_diam   avg_bron_bran_ang   avg_bron_grav_ang   avg_acin_len    avg_acin_diam   avg_acin_bran_ang   avg_acin_grav_ang
    1       10.56054    1.74822     0.00000         0.00000         10.56054        1.74822         0.00000             0.00000             0.00000         0.00000         0.00000             0.00000
    2       3.63224     1.35475     41.98550        0.50852         3.63224         1.35475         41.98550            0.50852             0.00000         0.00000         0.00000             0.00000
    3       1.81409     1.07572     24.76750        0.43180         1.81409         1.07572         24.76750            0.43180             0.00000         0.00000         0.00000             0.00000
    4       1.36685     0.89728     19.10195        0.44595         1.36685         0.89728         19.10195            0.44595             0.00000         0.00000         0.00000             0.00000
    5       1.30518     0.75285     21.54130        0.42747         1.30518         0.75285         21.54130            0.42747             0.00000         0.00000         0.00000             0.00000
    6       0.95747     0.65898     22.42838        0.42030         0.95747         0.65898         22.42838            0.42030             0.00000         0.00000         0.00000             0.00000
    7       0.75804     0.54638     24.46454        0.43363         0.75804         0.54638         24.46454            0.43363             0.00000         0.00000         0.00000             0.00000
    8       0.67340     0.47988     27.71756        0.48778         0.67340         0.47988         27.71756            0.48778             0.00000         0.00000         0.00000             0.00000
    9       0.54493     0.38845     31.18474        0.56222         0.54493         0.38845         31.18474            0.56222             0.00000         0.00000         0.00000             0.00000
    10      0.46824     0.30127     35.89431        0.66123         0.46824         0.30127         35.89431            0.66123             0.00000         0.00000         0.00000             0.00000
    11      0.38719     0.22997     39.73886        0.76708         0.38719         0.22997         39.73886            0.76708             0.00000         0.00000         0.00000             0.00000
    12      0.32092     0.17802     43.52692        0.86686         0.32092         0.17802         43.52692            0.86686             0.00000         0.00000         0.00000             0.00000
    13      0.25837     0.14139     46.64262        0.96250         0.25427         0.13953         44.38940            0.90503             0.00410         0.00186         2.25319             0.05747
    14      0.20842     0.11290     49.20440        1.05873         0.19511         0.10685         42.24406            0.87962             0.01331         0.00605         6.96035             0.17911
    15      0.16878     0.09120     50.75885        1.14311         0.14066         0.07842         36.15655            0.76938             0.02813         0.01278         14.60227            0.37374
    16      0.14687     0.07504     51.72076        1.21313         0.10165         0.05448         28.14170            0.60816             0.04522         0.02056         23.57898            0.60497
    17      0.13129     0.06357     52.86244        1.27863         0.07187         0.03657         20.99091            0.44788             0.05942         0.02701         31.87162            0.83074
    18      0.11716     0.05515     53.32086        1.31790         0.04674         0.02314         14.07483            0.30692             0.07042         0.03201         39.24610            1.01098
    19      0.10501     0.04891     53.99731        1.34750         0.02666         0.01329         8.58634             0.18521             0.07835         0.03561         45.41105            1.16229
    20      0.09547     0.04413     53.82188        1.36251         0.01453         0.00733         4.77370             0.10252             0.08094         0.03679         49.04815            1.25999
    21      0.08740     0.04015     53.87224        1.37367         0.00775         0.00395         2.59410             0.05656             0.07964         0.03620         51.27810            1.31711
    22      0.08121     0.03691     53.91568        1.36610         0.00000         0.00000         0.00000             0.00000             0.08121         0.03691         53.91568            1.36610
    23      0.07355     0.03343     52.93583        1.35354         0.00000         0.00000         0.00000             0.00000             0.07355         0.03343         52.93583            1.35354
    24      0.06504     0.02956     50.42516        1.28603         0.00000         0.00000         0.00000             0.00000             0.06504         0.02956         50.42516            1.28603
    25      0.05555     0.02525     46.12493        1.20065         0.00000         0.00000         0.00000             0.00000             0.05555         0.02525         46.12493            1.20065
    26      0.04546     0.02066     40.13730        1.02668         0.00000         0.00000         0.00000             0.00000             0.04546         0.02066         40.13730            1.02668
    27      0.03544     0.01611     33.02090        0.84774         0.00000         0.00000         0.00000             0.00000             0.03544         0.01611         33.02090            0.84774
    28      0.02592     0.01178     25.30087        0.65558         0.00000         0.00000         0.00000             0.00000             0.02592         0.01178         25.30087            0.65558
    29      0.01760     0.00800     17.76749        0.45427         0.00000         0.00000         0.00000             0.00000             0.01760         0.00800         17.76749            0.45427
    30      0.01123     0.00510     11.85168        0.30778         0.00000         0.00000         0.00000             0.00000             0.01123         0.00510         11.85168            0.30778
    31      0.00662     0.00301     7.29902         0.18767         0.00000         0.00000         0.00000             0.00000             0.00662         0.00301         7.29902             0.18767
    32      0.00341     0.00155     4.15552         0.10610         0.00000         0.00000         0.00000             0.00000             0.00341         0.00155         4.15552             0.10610
    33      0.00153     0.00069     2.00421         0.05132         0.00000         0.00000         0.00000             0.00000             0.00153         0.00069         2.00421             0.05132
    34      0.00046     0.00021     0.64400         0.01774         0.00000         0.00000         0.00000             0.00000             0.00046         0.00021         0.64400             0.01774
    35      0.00007     0.00003     0.09582         0.00295         0.00000         0.00000         0.00000             0.00000             0.00007         0.00003         0.09582             0.00295
This file belongs to one of the specified values of the parameter selected in the multiple_run. In this sample file, the simulation was conducted up to a depth of 35 generations, with the geometric parameters characteristic of each generation shown row by row.
output_**.dat
This file provides key insights into the distribution of inhaled particles across the lung generations. Deposition is only calculated where the particle actually reaches, as particles only travel to a certain depth based on the defined inhalation time. When the inhalation time is over, they stop and start moving back.
Each row in the file corresponds to a different generation number.
The columns represent the deposition ratios for the particles in various generations of the lung:
- Column 1 (gen): The generation number of the lung.
- Column 2 (avg_bronchial): The average deposition fraction of particles in the bronchial region of the lungs.
- Column 3 (avg_acinar): The average deposition fraction of particles in the acinar region of the lungs.
- Column 4 (avg_combined): The average deposition fraction of particles in the acinar and bronchial region of the lungs.
Example of output_**.dat file:
# upper airways : 0.04583
# bronchial : 0.09053
# acinar : 0.26568
# total : 0.40203
        #gen   avg_bronchial    avg_acinar    avg_combined
        1      0.0015126661     0.0000000000  0.0015126661
        2      0.0010180636     0.0000000000  0.0010180636
        3      0.0009316732     0.0000000000  0.0009316732
        4      0.0012309129     0.0000000000  0.0012309129
        5      0.0016169662     0.0000000000  0.0016169662
        6      0.0019082665     0.0000000000  0.0019082665
        7      0.0023554617     0.0000000000  0.0023554617
        8      0.0030616389     0.0000000000  0.0030616389
        9      0.0037692981     0.0000000000  0.0037692981
        10     0.0047688670     0.0000000000  0.0047688670
        11     0.0059432359     0.0000000000  0.0059432359
        12     0.0074188416     0.0000000000  0.0074188416
        13     0.0087379701     0.0003116676  0.0090496317
        14     0.0096798874     0.0013260538  0.0110059474
        15     0.0095916744     0.0035722076  0.0131639009
        16     0.0087447707     0.0072422312  0.0159869697
        17     0.0074194185     0.0114354305  0.0188548192
        18     0.0054673450     0.0160659067  0.0215332378
        19     0.0031919822     0.0207257271  0.0239177123
        20     0.0015069855     0.0249644127  0.0264713839
        21     0.0006501388     0.0293742195  0.0300243441
        22     0.0000000000     0.0351686999  0.0351686999
        23     0.0000000000     0.0359525420  0.0359525420
        24     0.0000000000     0.0354913101  0.0354913101
        25     0.0000000000     0.0238335989  0.0238335989
        26     0.0000000000     0.0130136982  0.0130136982
        27     0.0000000000     0.0053006900  0.0053006900
        28     0.0000000000     0.0014524353  0.0014524353
        29     0.0000000000     0.0004353340  0.0004353340
        30     0.0000000000     0.0000075308  0.0000075308
        31     0.0000000000     0.0000019182  0.0000019182
        32     0.0000000000     0.0000000054  0.0000000054
This file belongs to one of the specified values of the parameter selected in the multiple_run. In this sample file, the simulation was conducted up to a depth of 31 generations, with the average deposition fraction characteristic of each generation shown row by row.
Visualization:
The following two diagrams can be downloaded from the website.
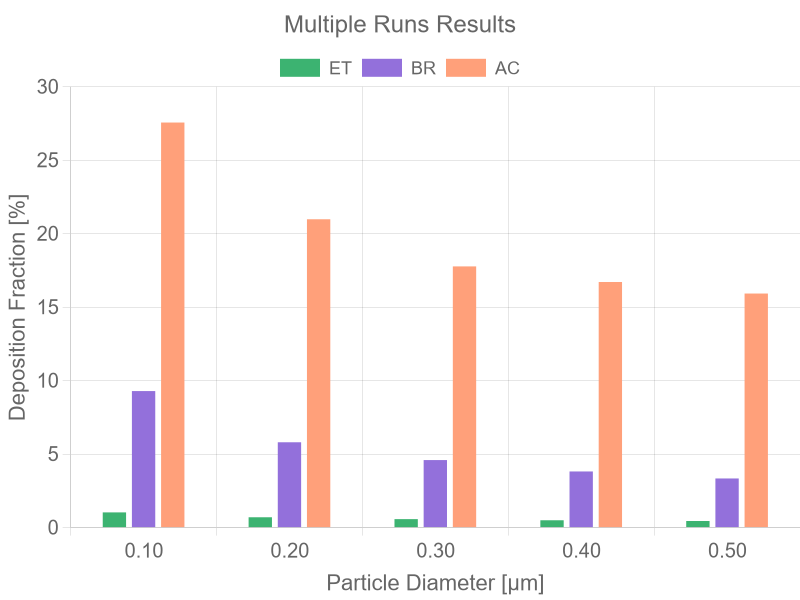
The first diagram uses bar groups to illustrate the particle deposition fractions associated with each multiple run element in different lung regions (extrathoracic – Et, bronchial – Br, acinar – Ac). This visualization helps to understand how inhaled particles distribute across various parts of the respiratory system under specific environmental or experimental conditions.
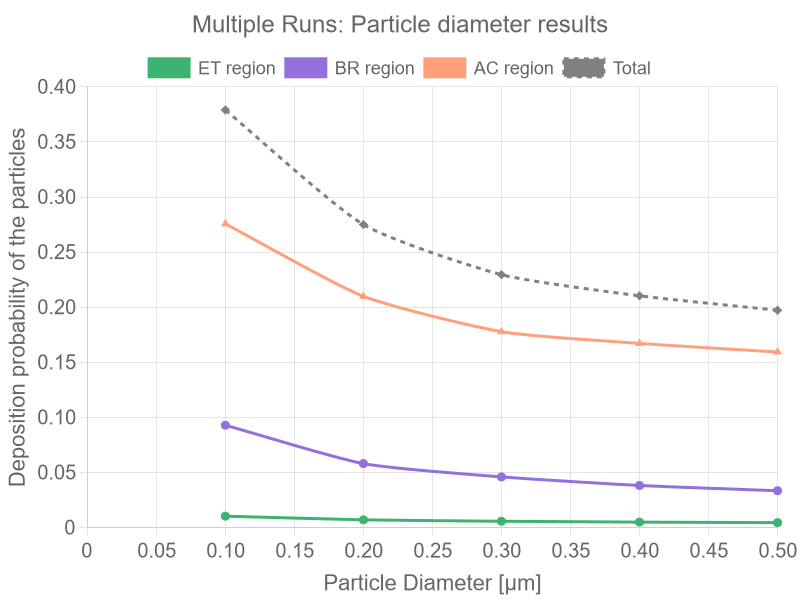
The second diagram represents deposition fractions in the three lung regions (extrathoracic, bronchial, acinar) as a function of particle size, along with the total deposition (avg_tot). This figure is only generated if the particle diameter parameter has been assigned multiple values during the multiple run, allowing for an analysis of the impact of size distribution.